The mechanical Properties of Virgin PTFE such as Compressive strength, Tensile strength, Creep & Impact behavior may vary with time, temperature, Crystanality & Fabrication method.

In some respects PTFE is a typical thermoplastic polymer; in others it is far from typical. Thus the mechanical properties of PTFE vary with changes in time, temperature and crystallinity in the way that one would expect of a thermoplastic. On the other hand, the fabrication methods used with PTFE can have a very large influence on the properties, particularly if unsatisfactory processing allows a particulate structure to persist into the fabricated article. PTFE is used only infrequently in tension so that it is appropriate to make measurements on samples in compression. The properties of design interest will be considered in some detail.

COMPRESSIVE STRESS-STRAIN RELATIONSHIPS OF PTFE
Although the classical concept of modulus, which implies a linear proportionality between stress and strain, is not strictly applicable to most plastics, the term is widely used and the resulting implications should be considered. The Young’s Modulus of a metal such as steel is the ratio of stress to strain in the elastic region, and is constant. For most plastics such a region does not exist and the ratio of stress to strain will not be constant but will depend both on the time for which the stress is applied and the resulting strain. The time-dependence of strain may be defined as the ‘creep’ behaviour and a study of creep, together with the equally important phenomenon of recovery, is essential for a full understanding of the mechanical properties. An apparatus has been specially developed for studying the compressive creep of PTFE: full details of this equipment have been published elsewhere but a general impression is given in Figure 9. With this equipment the stress-strain-time relationship at a constant temperature may be obtained by observing either the strain-time relationship at a constant stress (creep) (Figure 10), or the stress-strain relationship at a constant time (isochronous stress-strain curve) (Figure 11). The isochronous curve is derived by taking a constant time section through a family of creep curves and replotting the stress and strain values of the intersections to give the isochronous curve. The derivation is shown schematically in Figures 10 and 11. Alternatively the isochronous curve may be obtained experimentally on a single specimen by the application of a series of stresses (σ1 to σ6 Figure 11) in successively increasing steps and measuring the strain produced ( 1 to 6 Figure 11) after the section time, t, has elapsed, allowing a recovery period of 4t by complete removal of the stress on the specimen between each successive increase. The isochronous stress-strain curves presented here have been obtained in this way. Isometric curves (stress-time relationships at constant strain) may also be obtained by taking constant strain sections through a family of creep curves. At the termination of a creep experiment the phenomenon of recovery may be studied by removing the load on the specimen and observing the decrease of strain with time. It is convenient to present recovery data on a ‘fractional recovered strain’ versus ‘reduced time’ graph as an aid to comparison of data obtained on specimens which have either attained different maximum strains at the termination of the creep experiment or for which the times under load have not been identical. Fractional recovered strain is defined as the ratio of the strain recovered to the creep strain at the start of recovery and reduced time as the ratio of the recovered time to the creep time. Thus a fractional recovered strain of unity signifies complete recovery and a reduced time of unity denotes a recovery time equal to the preceding creep time.

Figure 9.Basic creep testing equipment
Figure 10. Compressive creep
Figure 10.Compressive creep
Figure 11. Isochronous stress-strain relationship in compression
Figure 11.Isochronous stress-strain relationship in compression

The following information is the result of work done on behalf of AG Fluoropolymers. A complete picture of the behaviour of PTFE has not yet been obtained, and in particular, work on effects of temperature is not complete. Nevertheless, enough data are now available to provide some basic information. The data given are for Fluon® G163 preformed at a pressure of about 16 MN/m2 (160 kgf/cm2; 1 tonf/in2), and sintered at 380°C (716°F).

Isochronous stress-strain behaviour OF PTFE
Figure 12 shows the effect of time on the stress-strain relationship of Fluon® G163. The non-linearity of the curves, even at quite low strains, shows how the apparent modulus decreases with increasing strain
Recovery from Creep behaviour OF PTFE
Figure 13 shows a family of creep curves at various stress levels, while Figure 14 shows the same information plotted as stress against time for various strain levels. It should be noted that the latter are not true stress relaxation curves, though the curves should give a very approximate indication of the decay of stress with time in a component maintained at a constant strain level.
Impact Behavior OF PTFE
Figure 15 shows the effect of four different stress levels on the rate of recovery of strain after removal of the applied compressive load. It can be seen that the higher the stress the slower is the recovery.

Figure 12. Isochronous stress-strain relationship in compression, at 25°C (77°F), Fluon® G163
Figure 12.Isochronous stress-strain relationship in compression, at 25°C (77°F), Fluon® G163
Figure 13. Creep in compression, at 25°C (77°F), Fluon® G163
Figure 13.Creep in compression, at 25°C (77°F), Fluon® G163
Figure 14. Isochronous stress-strain curves in compression, at 25°C (77°F) and various strain levels, Fluon® G163
Figure 14.Isochronous stress-strain curves in compression,at 25°C (77°F) and various strain levels,Fluon® G163
Figure 15. Recovery from creep in compression, at 25°C (77°F), Fluon® G163
Figure 15.Recovery from creep in compression, at 25°C (77°F), Fluon® G163
TENSILE PROPERTIES OF PTFE

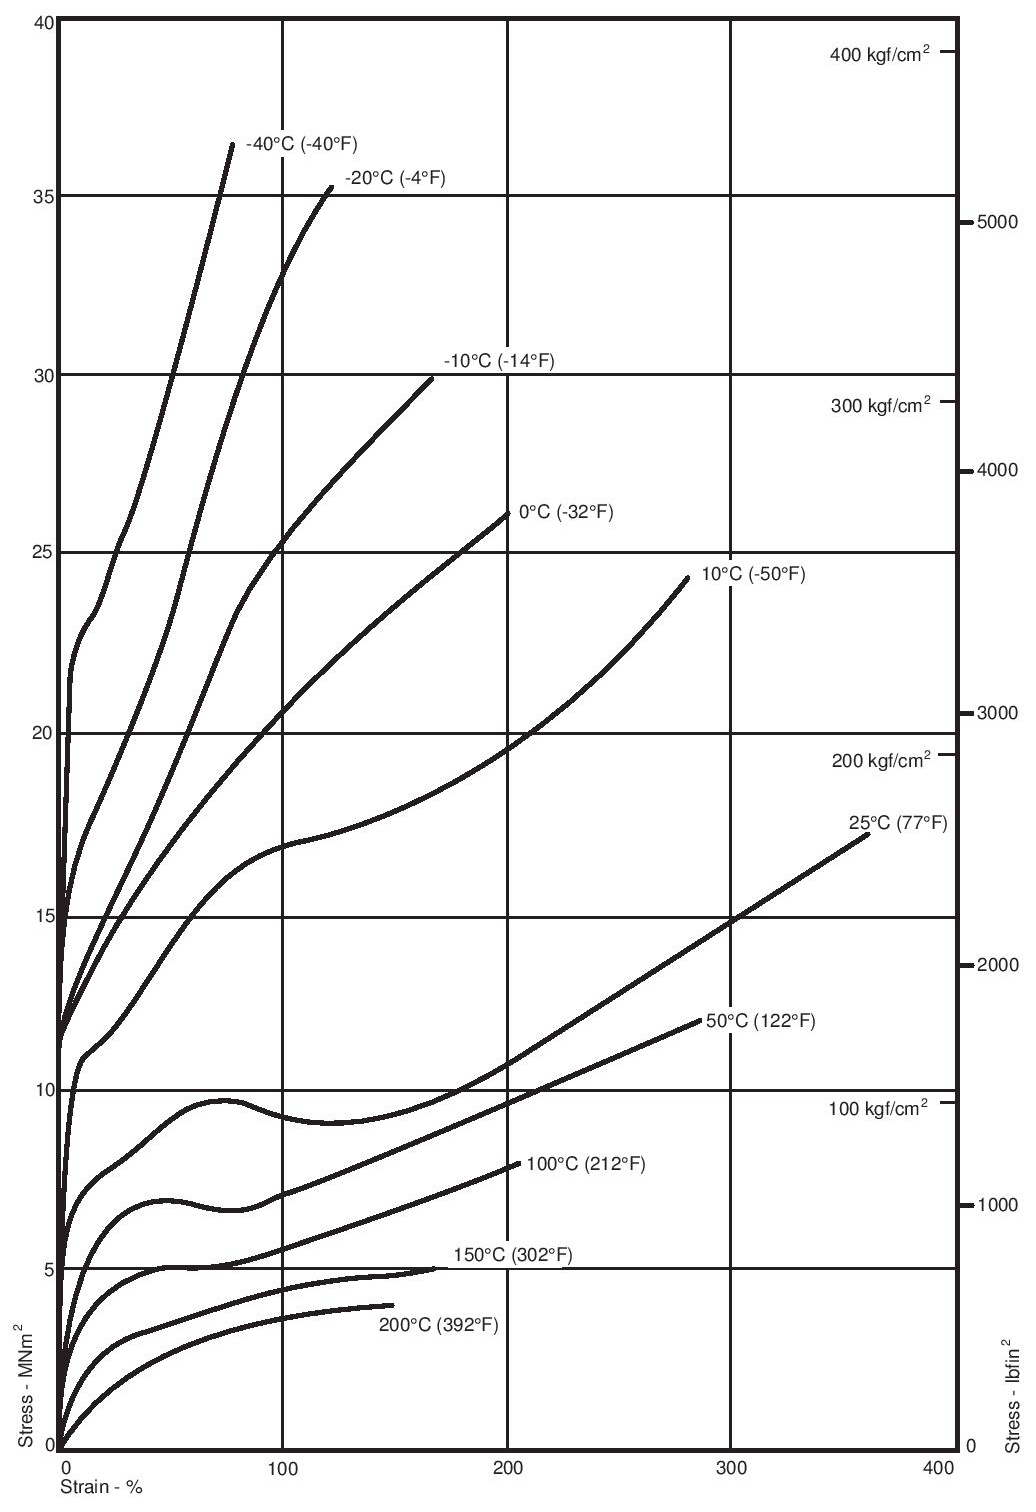
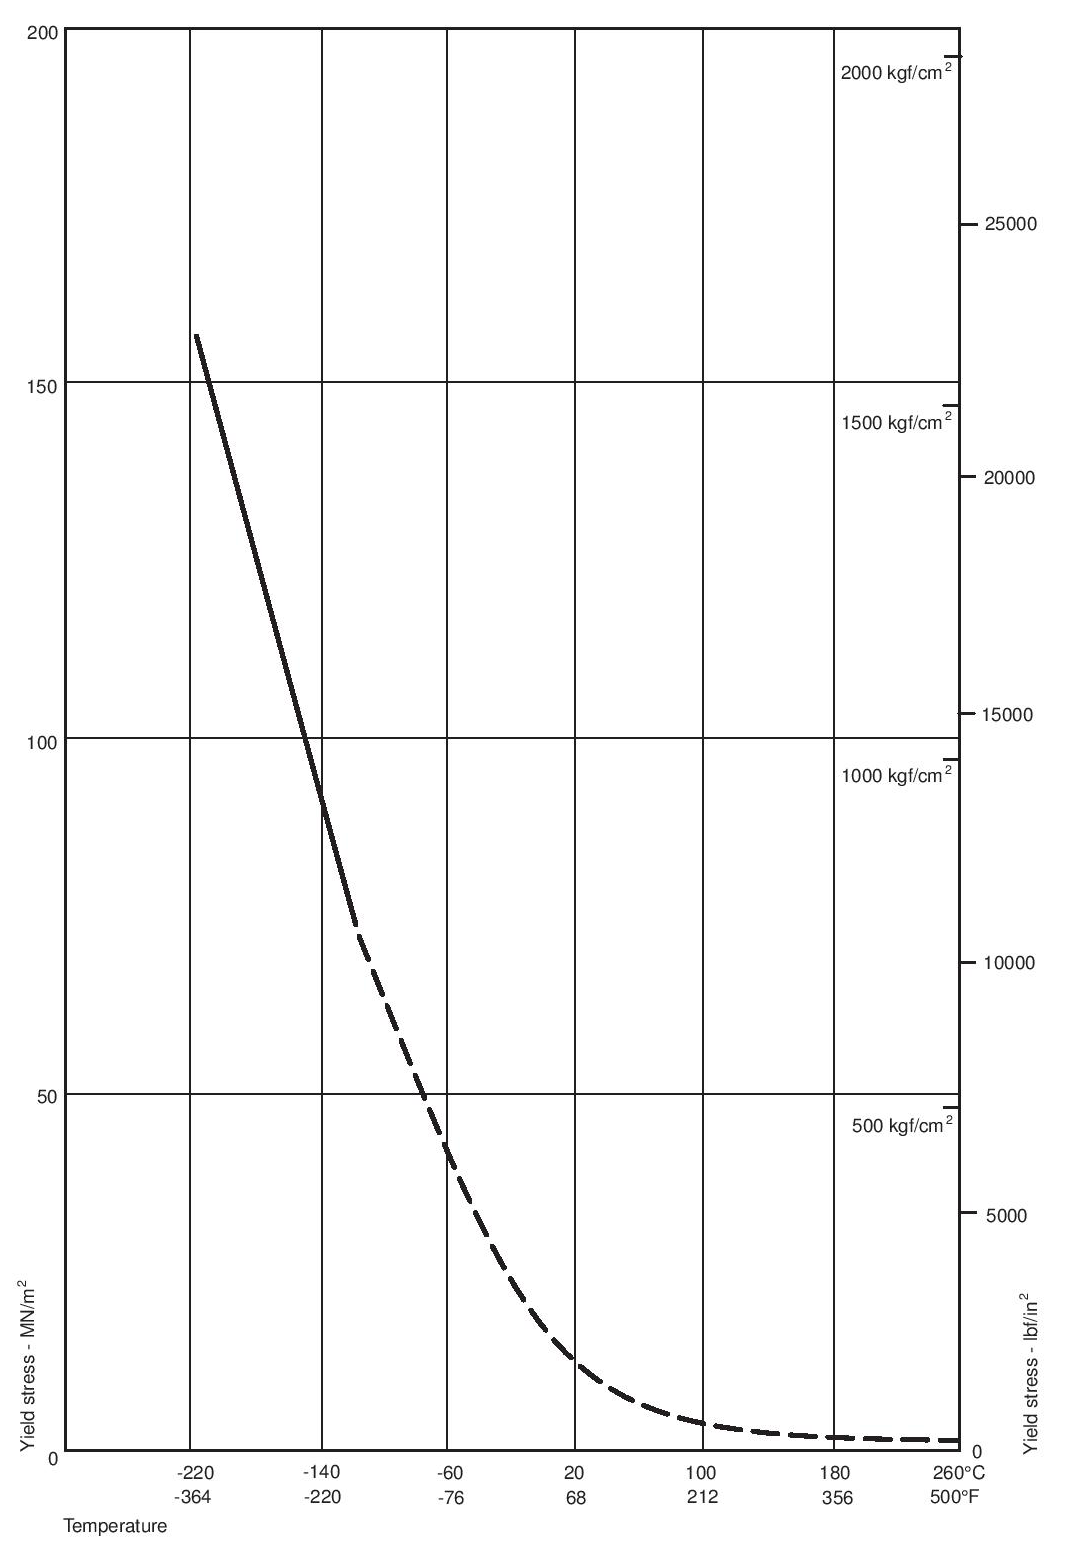
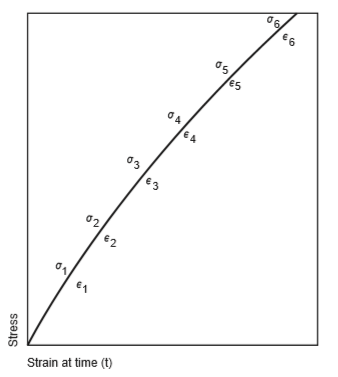
The tensile breaking stress and breaking strain are used extensively for quality control purposes, but they are unsatisfactory quantities for design purposes for two reasons: firstly, and most importantly, PTFE should never be used at strains beyond the yield point (the point at which the load-deformation curve has a distinct change of slope) and secondly, the point of fracture is dependent on specimen shape and is therefore not useful for predicting behaviour in practice. The tensile load-extension curves obtained with specimens of PTFE depend on crystallinity, molecular weight, the size, shape and perhaps the structure of the original particles and the severity of faults remaining after fabrication. Furthermore they depend, as is usual with thermoplastics, on test temperature and straining rate. Because of these complications the data here can only be indicative of general behaviour. Figure 16 shows the general trends of behaviour in tension for PTFE as a function of temperature. These are typical curves from which the yield stress can be derived, though less precisely than is possible for most other plastics materials. The effect of temperature on the yield stress of PTFE is shown in Figure 17, which is for times to yield of approximately one minute. If the material is to be under load for any considerable length of time it should not be stressed beyond a small fraction of the yield stresses shown in Figure 17.

IMPACT BEHAVIOUR

The behaviour of plastics under impact conditions depends both on temperature and on the severity of the applied stress, as well as on molecular parameters such as molecular weight and fabrication effects. PTFE is no exception to these generalisations and with the wide variation in fabrication procedures available for this polymer it is impossible to give other than general data. Unnotched specimens of PTFE are resistant to fracture on impact; even at temperatures as low as -196°C (320°F) well-fabricated specimens are tough. A test for judging the quality of a sample from this point of view is to measure the flexural strength of specimens which have been immersed for 15 minutes in liquid nitrogen and then tested within a few seconds of removal. In this liquid nitrogen dip test which was carried out with three point loading, a span of 38mm (1.5 inches), a thickness of 3.2mm (0.125 inch) and a rate of test of 457mm / min (18 inches / min) good specimens of PTFE do not break at the maximum load, the apparent yield stress of such a specimen being approximately 185 MN/m2 (1900 kgf / cm2; 27 000 lbf / in2). However, less well-fabricated specimens may be brittle with flexural strengths of approximately 135 MN/m2 (1400 kgf / cm2; 20 000 lbf / in2) in this test. The behaviour of notched specimens typifies the reaction of PTFE components with built-in stress concentration regions. This is shown by measurements of the Charpy impact strength: the test was carried out with three-point loading and an impact velocity of 2.44m / second (8 ft / second) at temperatures between -35 and +23°C (-31 and +73°F). One sample was cooled slowly at 25°C / hour (45°F / hour) and another cooled from the sintering temperature of 380°C (716°F) to 20°C (68°F) in two hours. The notch tip radius of the specimens was varied between 0.25mm (0.01 inch) and 2.03mm (0.08 inch), spans of 25mm (1 inch) and 38mm (1.5 inch) were used and the notch depth was held constant at 2.82mm (0.110 inch). There was no consistent difference between the impact strengths of the samples cooled at different rates. At temperatures of -20°C (-4°F) and below all notched specimens broke completely, [impact strength in the range 6 to 10 kgf / cm2 (3 to 5 ft Ibf / in2), with an 0.25mm (0.010 inch) notch], whilst at -10°C (+14°F) and above many specimens did not break completely - that is to say ‘hinge’ breaks occurred.

Figure 16. Effect of temperature upon tensile stress-strain curves for PTFE
Figure 17. Effect of temperature upon tensile yield stress of PTFE