
The mechanical Properties of Filled PTFE such as compressive deformation, Impact strength are substantrally improved by reinforcement of filler in PTFE.
The compressive creep behaviour of filled PTFE is one of the most significant properties to the designer and user. In comparison with unfilled PTFE the compressive modulus of filled PTFE is greater and hence, for the same stress, a lower deformation will occur. This difference diminishes, however, as temperatures rise and the compressive performance of unfilled and filled PTFE draws close together at 200°C (392°F). The reason is almost certainly that the general reduction in the compressive modulus of the PTFE matrix overrides the support given by the random distribution of filler particles. Table 3 gives approximate values for the stressstrain relationship at different temperatures for 25% Glass Filled PTFE. These data are based on laboratory tests and the configuration of the test specimens will have a significant effect on the results obtained. For this reason the figures should only be taken as a very approximate guide. The room temperature creep behaviour of filled PTFE has been studied and Figures 24 and 25 show how strain varies with time and also at various stress levels for 25% glass-filled PTFE and, for comparison purposes, for Virgin PTFE. Figure 26 illustrates the relationship between stress and strain in a way which indicates the stress relaxation that can occur in PTFE with time. Figure 27 shows the divergence in creep behaviour between Filled PTFE grades containing 25%, 22% and 40% of filler by volume. Figure 27 used in conjunction with Figure 24 indicates the relative creep behaviour of filled PTFE grades. Individual design details of specific applications are bound, however, to significantly modify the data given in Figures 24 and 27.
| Stress - kgf / cm2 at T : °C | |||||||
|---|---|---|---|---|---|---|---|
| 20 | 60 | 100 | 140 | 180 | 220 | 250 | |
| 1% strain | 63 | 37 | 27 | 17 | 10 | 8 | 6 |
| 2% strain | 89 | 60 | 47 | 32 | 20 | 15 | 11 |
| 3% strain | > 89 | 75 | 61 | 43 | 28 | 22 | 17 |
| 4% strain | > 89 | 86 | 71 | 53 | 36 | 28 | 22 |
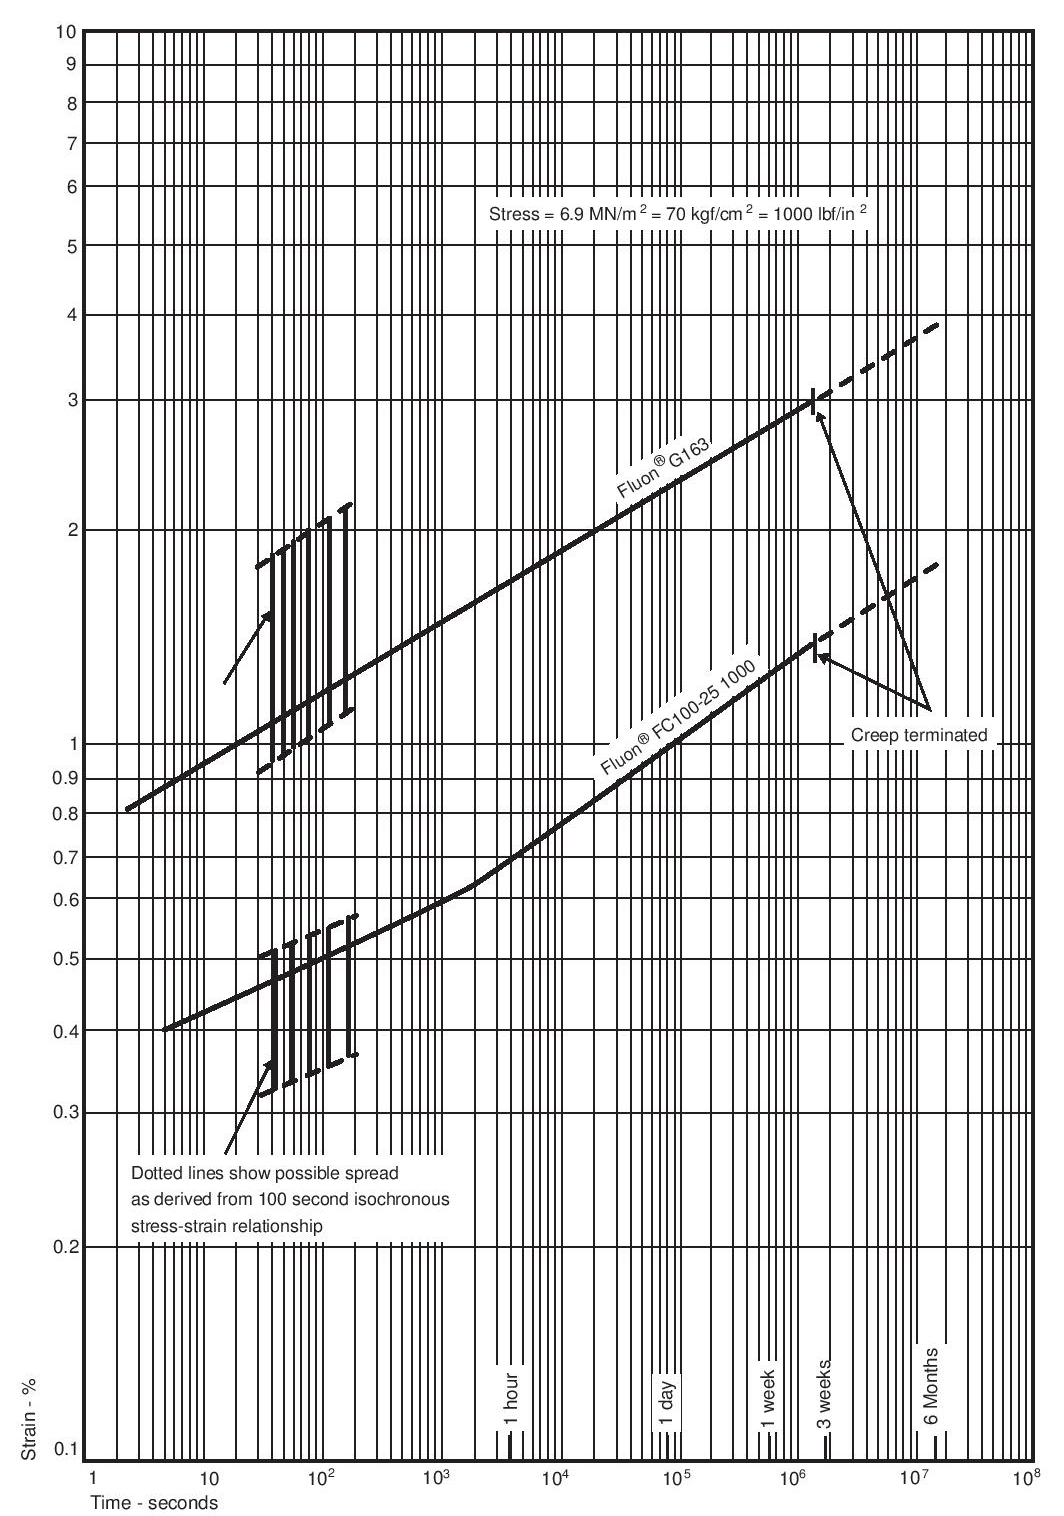
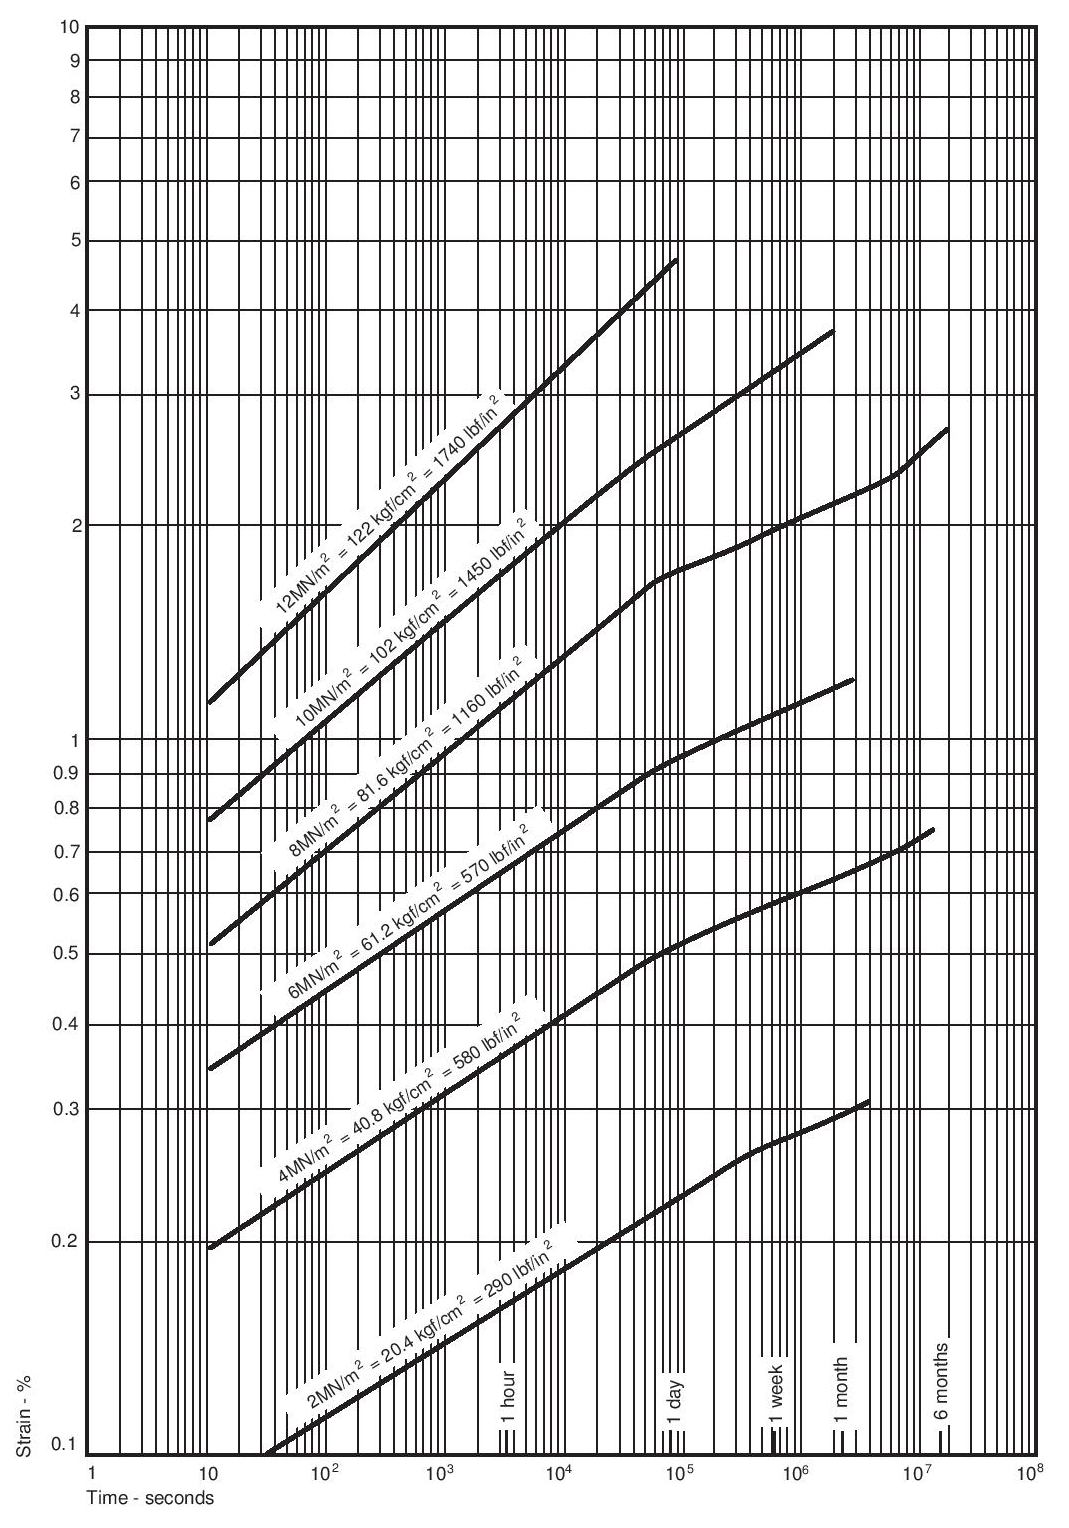
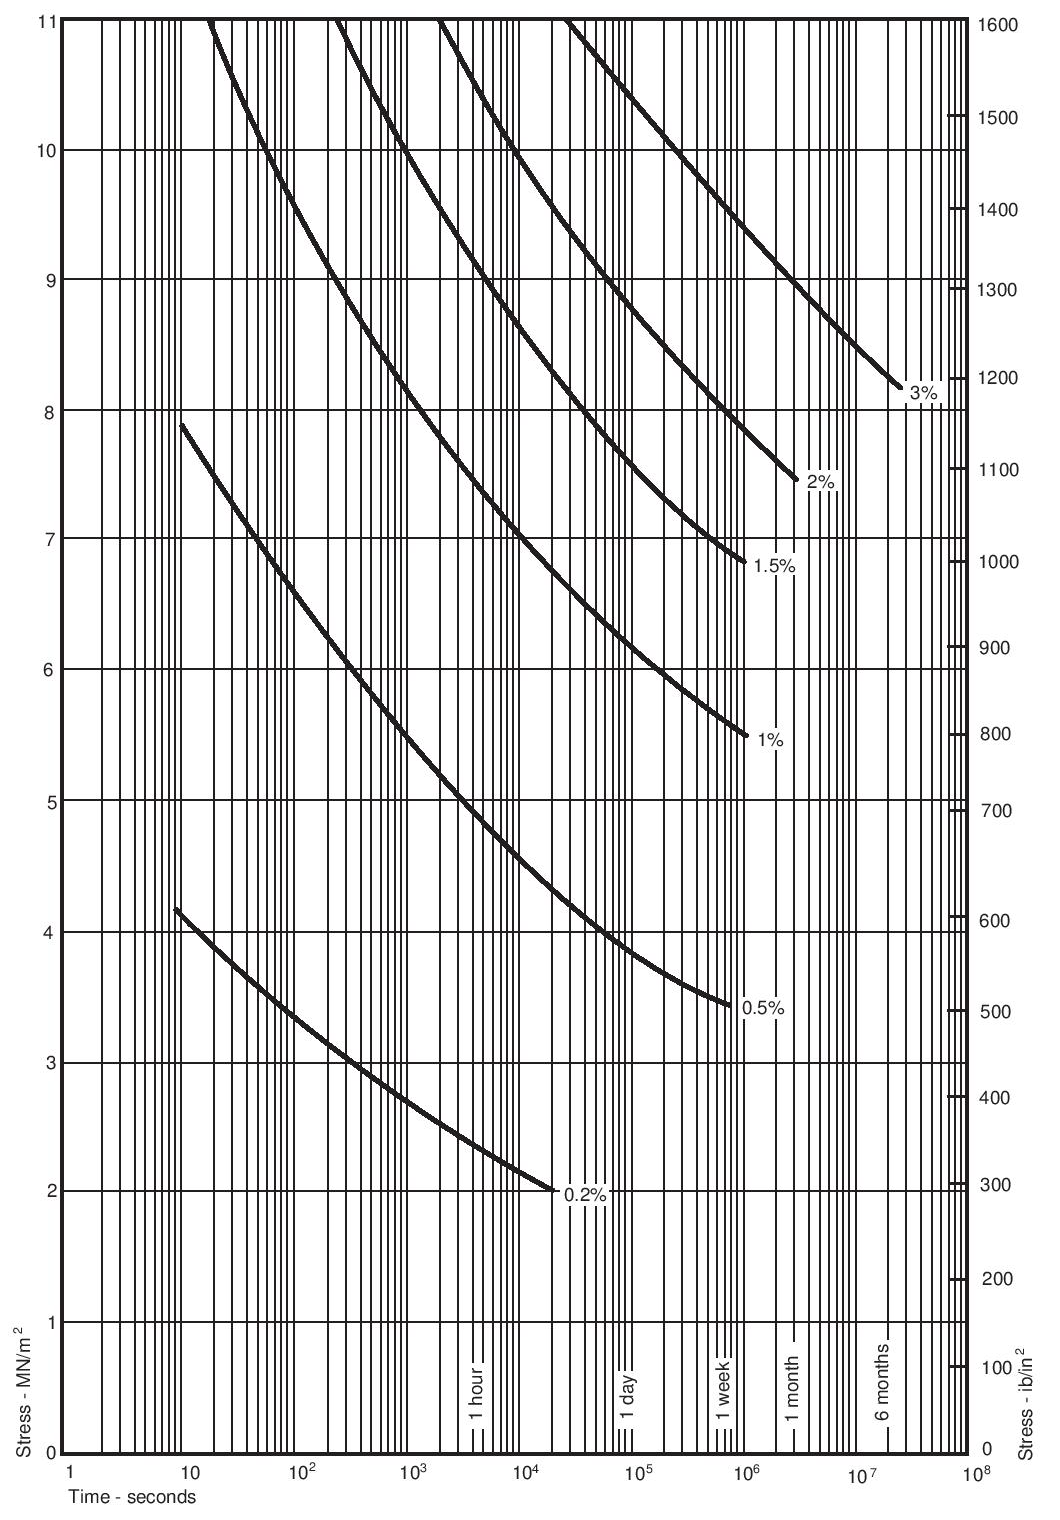
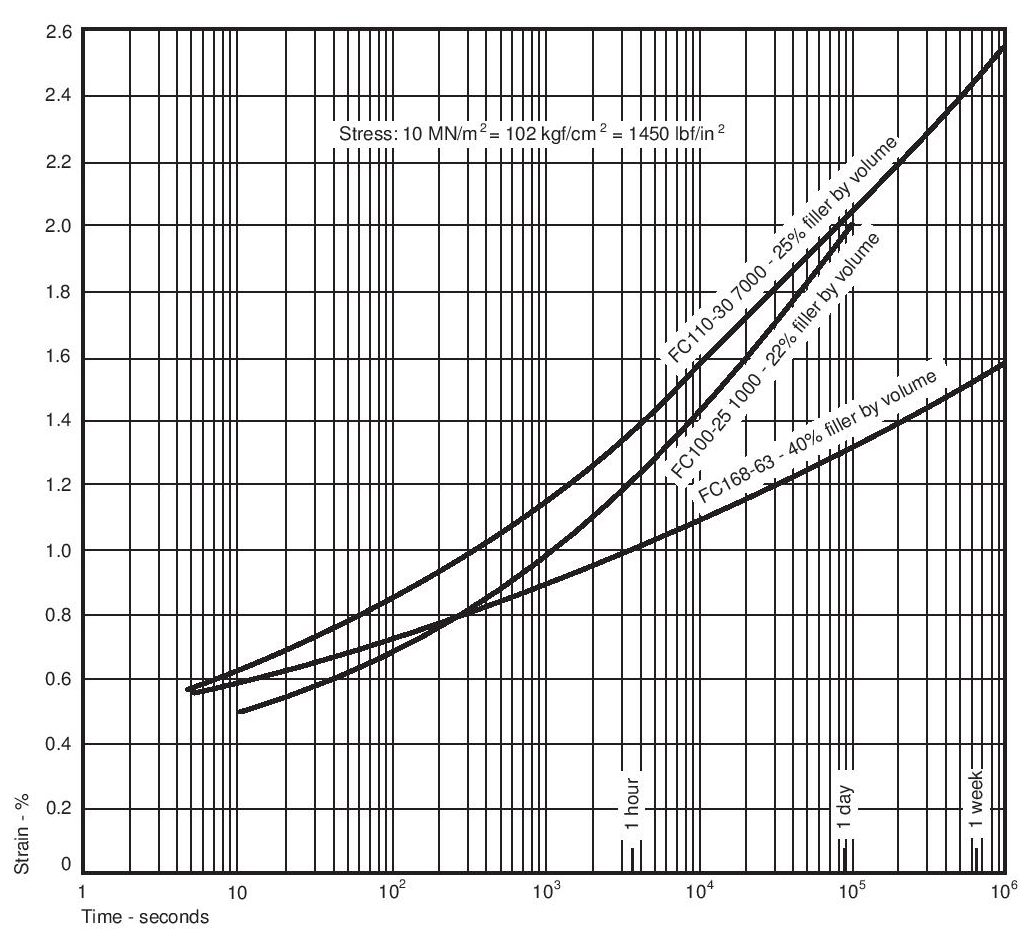
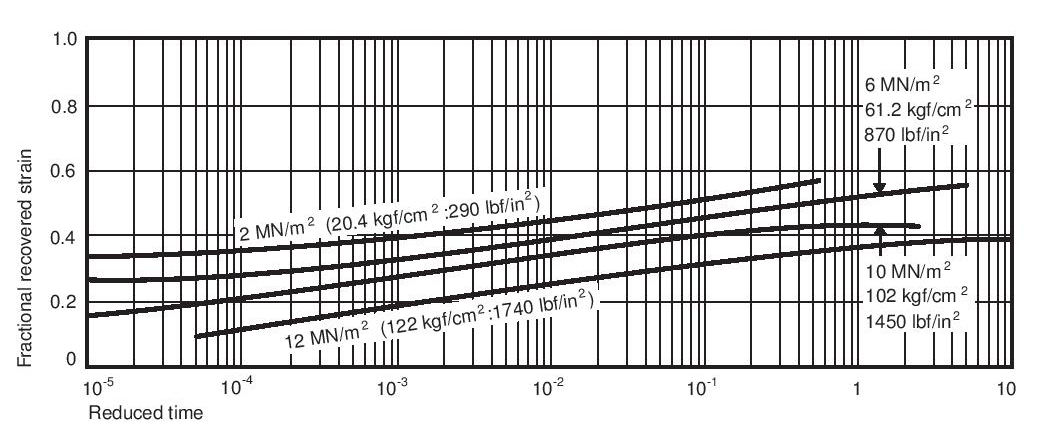
Table 4 shows the results of Charpy impact tests on various PTFE and Filled PTFE grades, at different temperatures and different crystallinities. All specimens were sharply notched (notch tip radius = 0.25mm; 0.01 inch) but even so none of the specimens broke completely, but gave a hinge break at + 20°C (68°F). At -20°C (-4°F) all the slowcooled (high crystallinity) samples broke completely, but two of the six quenched samples (low crystallinity) gave hinge breaks. In the liquid nitrogen dip test, all specimens broke completely; strengths were always lower than at -20°C (-4°F) and again the lower crystallinity material gave increased resistance to impact. There are minor differences between the various PTFE and Filled PTFE grades and, as expected, a low crystallinity gives maximum impact strength. The conclusion is that unfilled and filled PTFE are tough in impact, even under severe test conditions e.g. with sharp notches at -20°C (-4°F) (see Table 4). They are better than most other plastics.
Table 4. Charpy impact strength (notch depth 2.80 mm: 0.11 inch; notch tip radius 0.25 mm: 0.01 inch)| Median impact strength (cm kgf / cm2) | Liquid nitrogen | ||||
|---|---|---|---|---|---|
| + 20°C (68°F) | -20°C (-4°F) | (-180°C approx) | (-290°F approx) | ||
| Slow cooled | Quenched | Slow cooled | Quenched | ||
| Unfilled PTFE | H* | 6.8-9.0 | 8.6-9.6 | - | - |
| 15% Glass Filled PTFE | - | 12.0 | H | 4.5 | 5.6 |
| 25% Glass Filled PTFE | H | 9.4 | H | - | - |
| 60% Bronze Filled PTFE | - | 10.9 | 12.8 | 4.1 | 4.5 |
| 25% Coke Filled PTFE | - | 7.3 | 7.9 | 3.2 | 3.2 |
Notes:
H = hinge break i.e. did not break completely.
H* = specimen almost broke completely.